
Having the capability to visualize data is a crucial part of any wastewater team’s inspection workflow, and WinCan’s flexible GIS integrations makes it easier than ever to do so.
Map Pathways
There are several pathways for creating a comprehensive map of your wastewater system, including WinCan’s seamless integration with Esri’s ArcGIS and newer ArcPro. As an alternative, WinCan’s Expert Package comes equipped with WinCan Maps, which can be used as a standalone mapping software, or combined with ArcGIS.
“If a customer already has ArcGIS, it can be easily installed into the inspection truck and connected to WinCan VX,” says Mike Russin, general manager of WinCan. “But if a contractor does not have it, and they're working for a city that provides them ArcGIS data, they can use WinCan Maps to automatically import all of that data. Customers can choose either mapping software, or a combination of both, which gives them a lot of flexibility—no matter where the GIS data comes from, we can connect WinCan to it.”
Transferring Data
The import process is simple: all header information from an existing GIS map, including manhole numbers, pipe IDs, street names, pipe material and sizes, etc., can be auto-populated into WinCan VX with the press of a button. This not only makes it easier on the operator, who would otherwise input all of the data manually, but also eliminates the opportunity for simple typing errors.
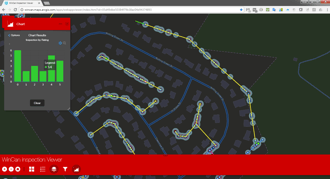
Once the GIS data is imported, the operator can begin performing inspections within WinCan VX, tracking progress, noting observations and distances, and more. That inspection data can then be imported back into ArcGIS or WinCan Maps to create a detailed visual map.
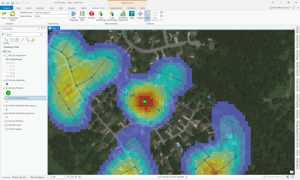
“Using data from the operator, the map can be used to visualize both work progress and the condition of each line in the system,” Russin says. “Whether you’re using ArcGIS or WinCan Maps, we can set up a symbology layer which color codes lines to identify which have been televised and which haven’t, which are high severity and which are low, and where cluster areas may exist. All of this visual data helps the crew make informed maintenance and rehabilitation decisions based on a clear visual assessment of the system.”
That comprehensive map can then be published via ArcGIS online or via WinCan Web. Cloud-based WinCan Web makes it easy and secure to share data across teams and departments. With WinCan Web, centralized asset data can be viewed remotely on any browser-enabled device, whether a phone, tablet, laptop or computer.
To learn more about WinCan VX and its GIS integrations, request a free demo and speak with one of our experts today: