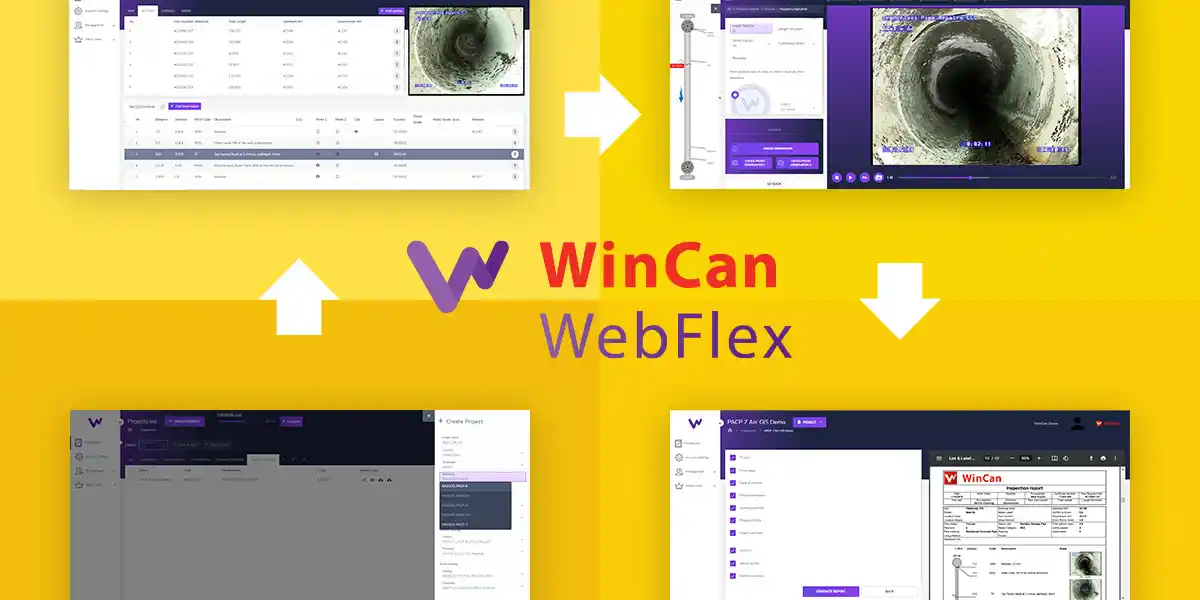
As the sewer inspection industry has evolved, the trend has been a shift from slow mechanical methods to automated digital processes. WinCan has pioneered new ways for municipalities and contractors to understand wastewater systems and manage their sewer data, and now we’re streamlining the way users engage with those solutions.
WinCan
Recent Posts
How to Switch to a Digital Software Key
[fa icon="calendar'] Aug 20, 2021 3:19:06 PM / by WinCan
Download the Quick Guide: Mapping With WinCan
[fa icon="calendar'] Aug 16, 2021 10:59:49 AM / by WinCan
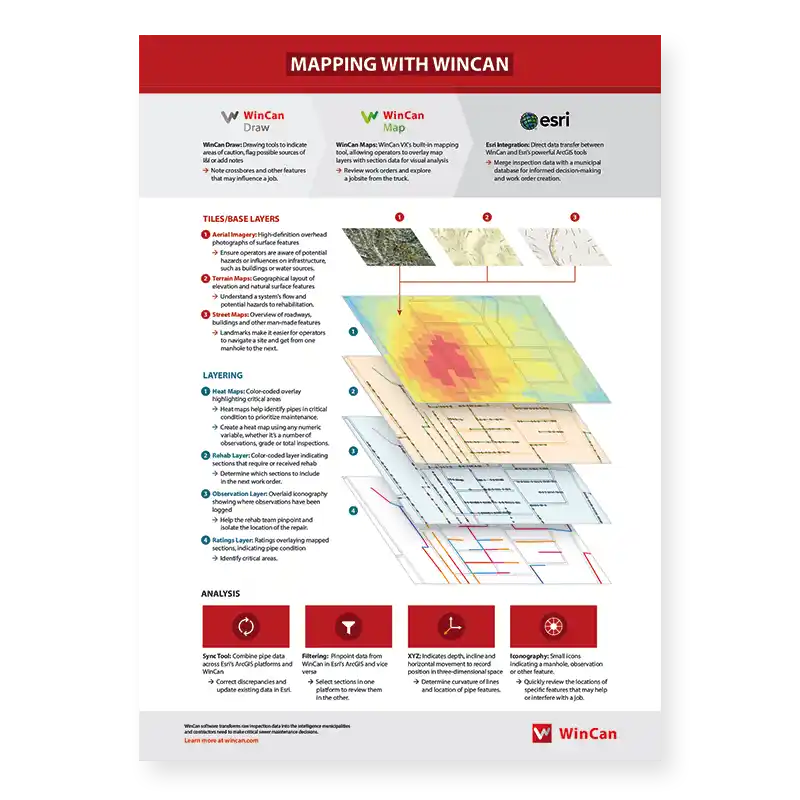
WinCan’s new downloadable quick guide, Mapping With WinCan, is a valuable resource for operators and engineers alike. With helpful descriptions and examples of tiling, layering and analysis tools, this guide introduces users to WinCan’s array of mapping features and workflows.
Integration Spotlight: Esri
[fa icon="calendar'] Aug 9, 2021 11:26:35 AM / by WinCan
More than ever before, municipalities are working to build digital models of their sewer networks that reveal the intricacies of both form and function. GIS mapping software has become an essential tool in this endeavor, and for many sewer professionals, Esri’s ArcGIS stands out as the pinnacle of geographic information systems.
Watch the Webinar: WinCan Sewermatics AI-Powered Data Services
[fa icon="calendar'] Aug 4, 2021 11:31:36 AM / by WinCan
In May 2021, WinCan introduced Sewermatics data services into its suite of wastewater infrastructure management technologies, enhancing the asset management ecosystem WinCan users have come to rely on. In this webinar, Sewermatics’ business development manager, Yaman Omar, and WinCan's general manager for the Americas, Mike Russin, showcase the full breadth of AI-powered data services and the industry pain points they aim to address.
Customize Wastewater Inspection Reports in WinCan VX
[fa icon="calendar'] Jul 22, 2021 1:54:58 PM / by WinCan
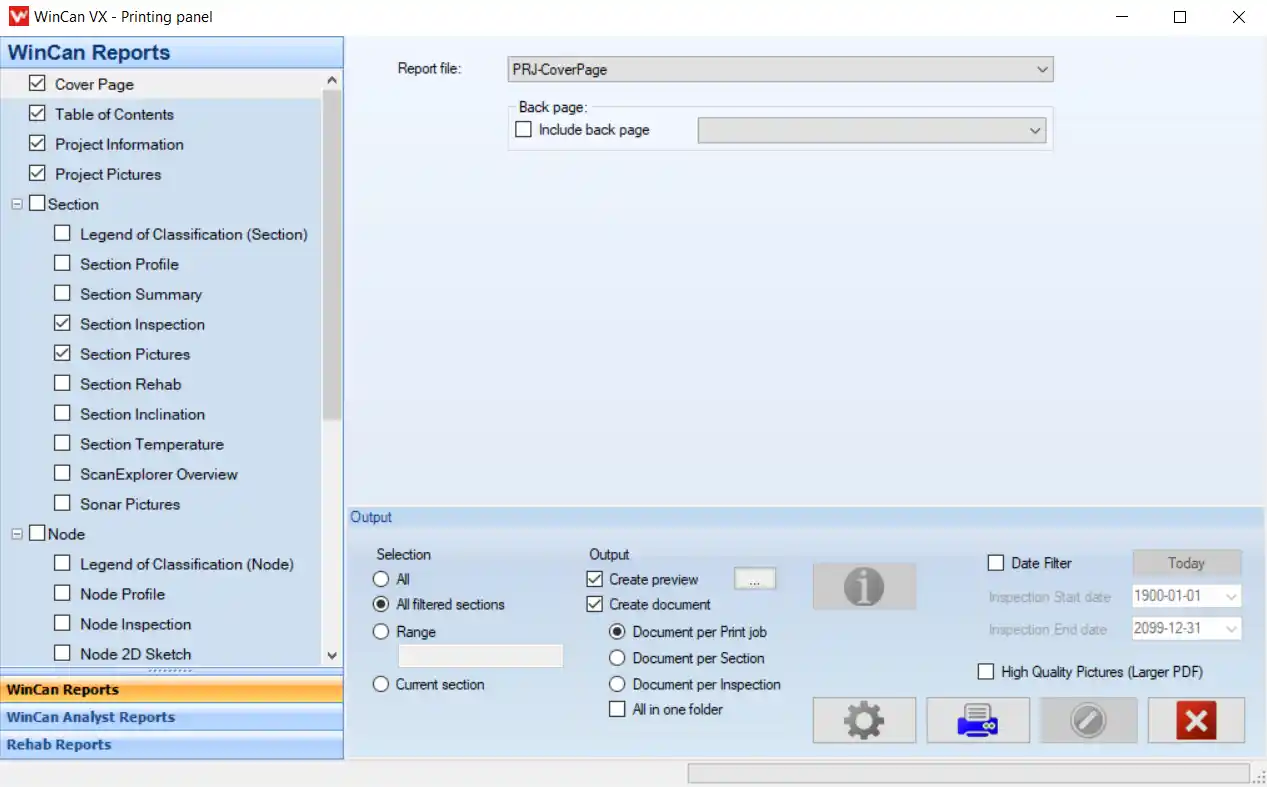
Sewer inspection reports allow wastewater teams to review and share vital information about a system’s condition, functionality, risks and maintenance plan. They highlight data from sections, inspections, observations or ratings, and they serve as records that can be referenced for future maintenance, planning and trends. And the data they contain ensures more informed decisions are made regarding rehabilitation and inspection.
Measuring Ovality With WinCan Laser Scan
[fa icon="calendar'] Jul 12, 2021 2:52:29 PM / by WinCan
Ovality measurements can identify potential risks to a pipe’s integrity, making them a vital part of sewer inspection and maintenance. With a laser profiler and WinCan on hand, wastewater teams can easily gather information about a pipe’s diameter as part of a routine inspection. Inspection teams simply need to gather media, calibrate the Laser Scan module in WinCan and record the data.
Sewer Basics: What Do Treatment Plants Do?
[fa icon="calendar'] Jun 16, 2021 1:13:07 PM / by WinCan
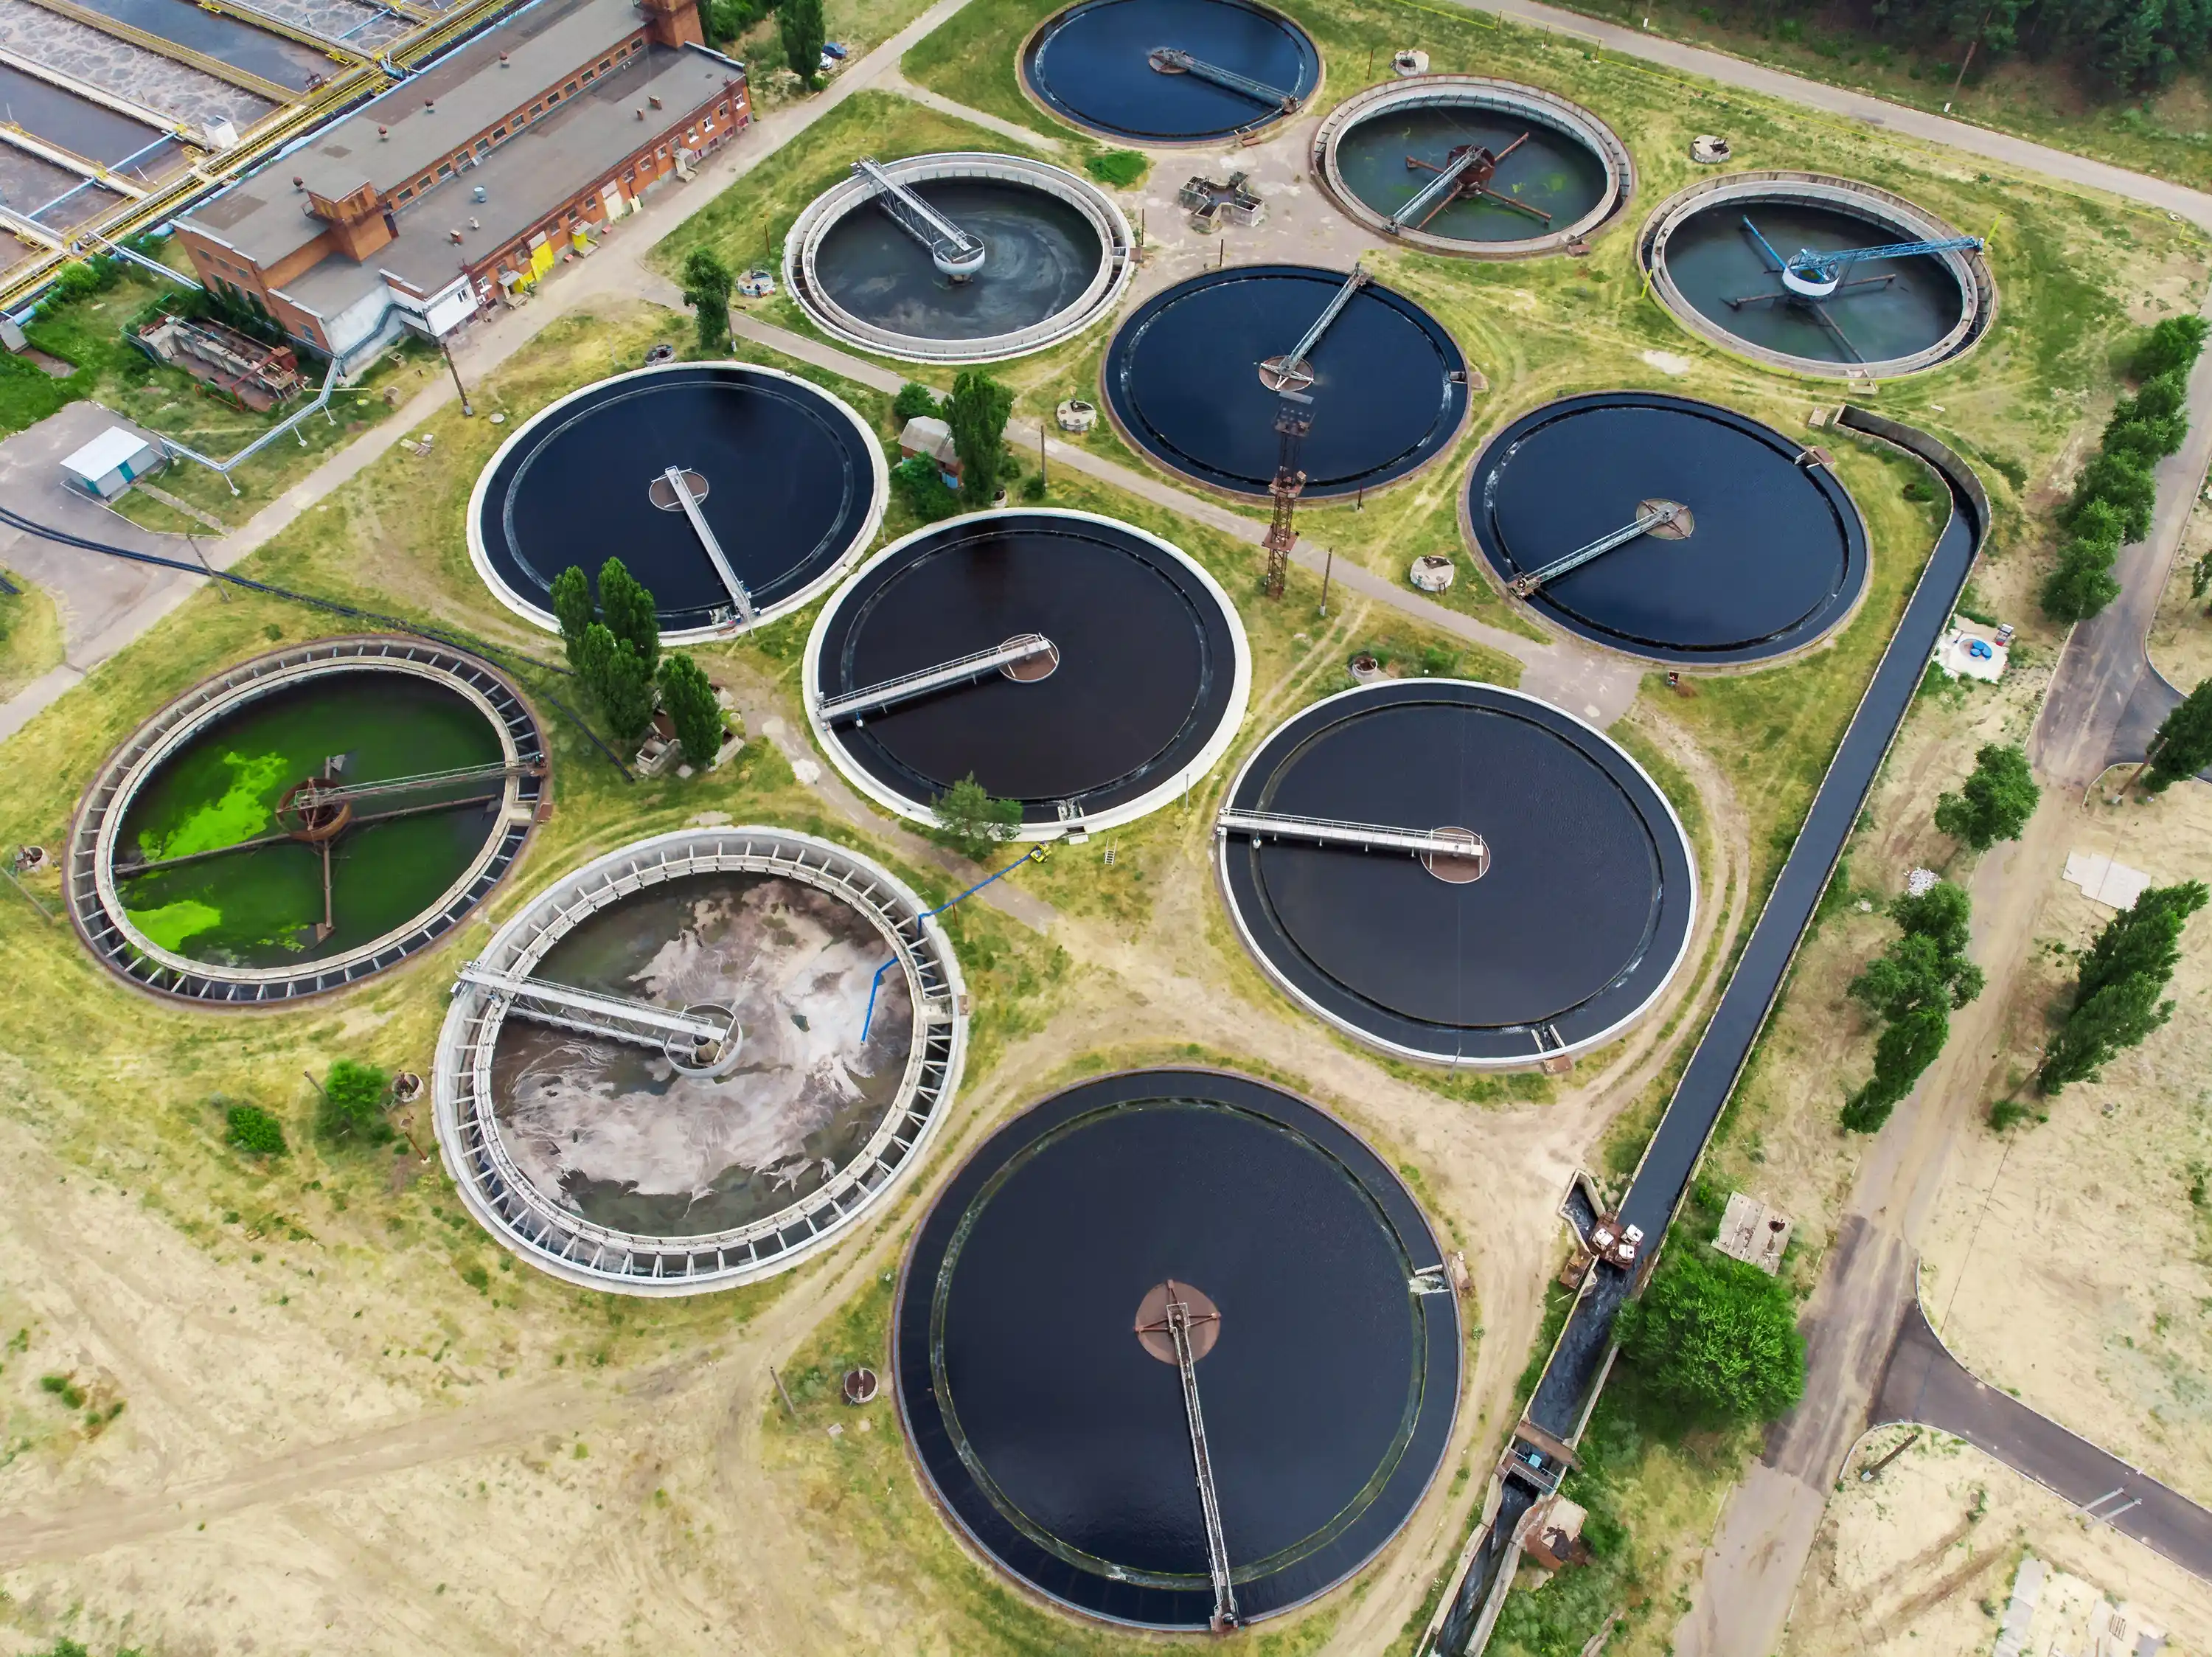
When your primary focus is sewer inspections, it’s easy to lose sight of wastewater’s intended destination: a treatment plant. Wastewater treatment is the process of removing organic and inorganic matter, chemicals and other pollutants from water, ensuring it is clean and safe for discharge into the local environment.
Creating a Flexible Sewer Inspection Workflow
[fa icon="calendar'] Jun 11, 2021 4:19:13 PM / by WinCan
Sewer inspection workflows vary from one municipality to the next. They are often built around the structure of the inspection team, but equipment, budget and the size of a sewer system all play an important role in determining what workflow makes the most sense for a given community. With so many different inspection, asset management and mapping solutions on the market today, there is no end to the possibilities. Take a look at the workflows below to get an idea of how WinCan workflows compare to more traditional, manual workflows.
Sewer Trivia: MACP Components
[fa icon="calendar'] Jun 4, 2021 12:03:35 PM / by WinCan
Data Visualization Informs, Enhances Sewer Inspection
[fa icon="calendar'] Jun 1, 2021 5:15:59 PM / by WinCan
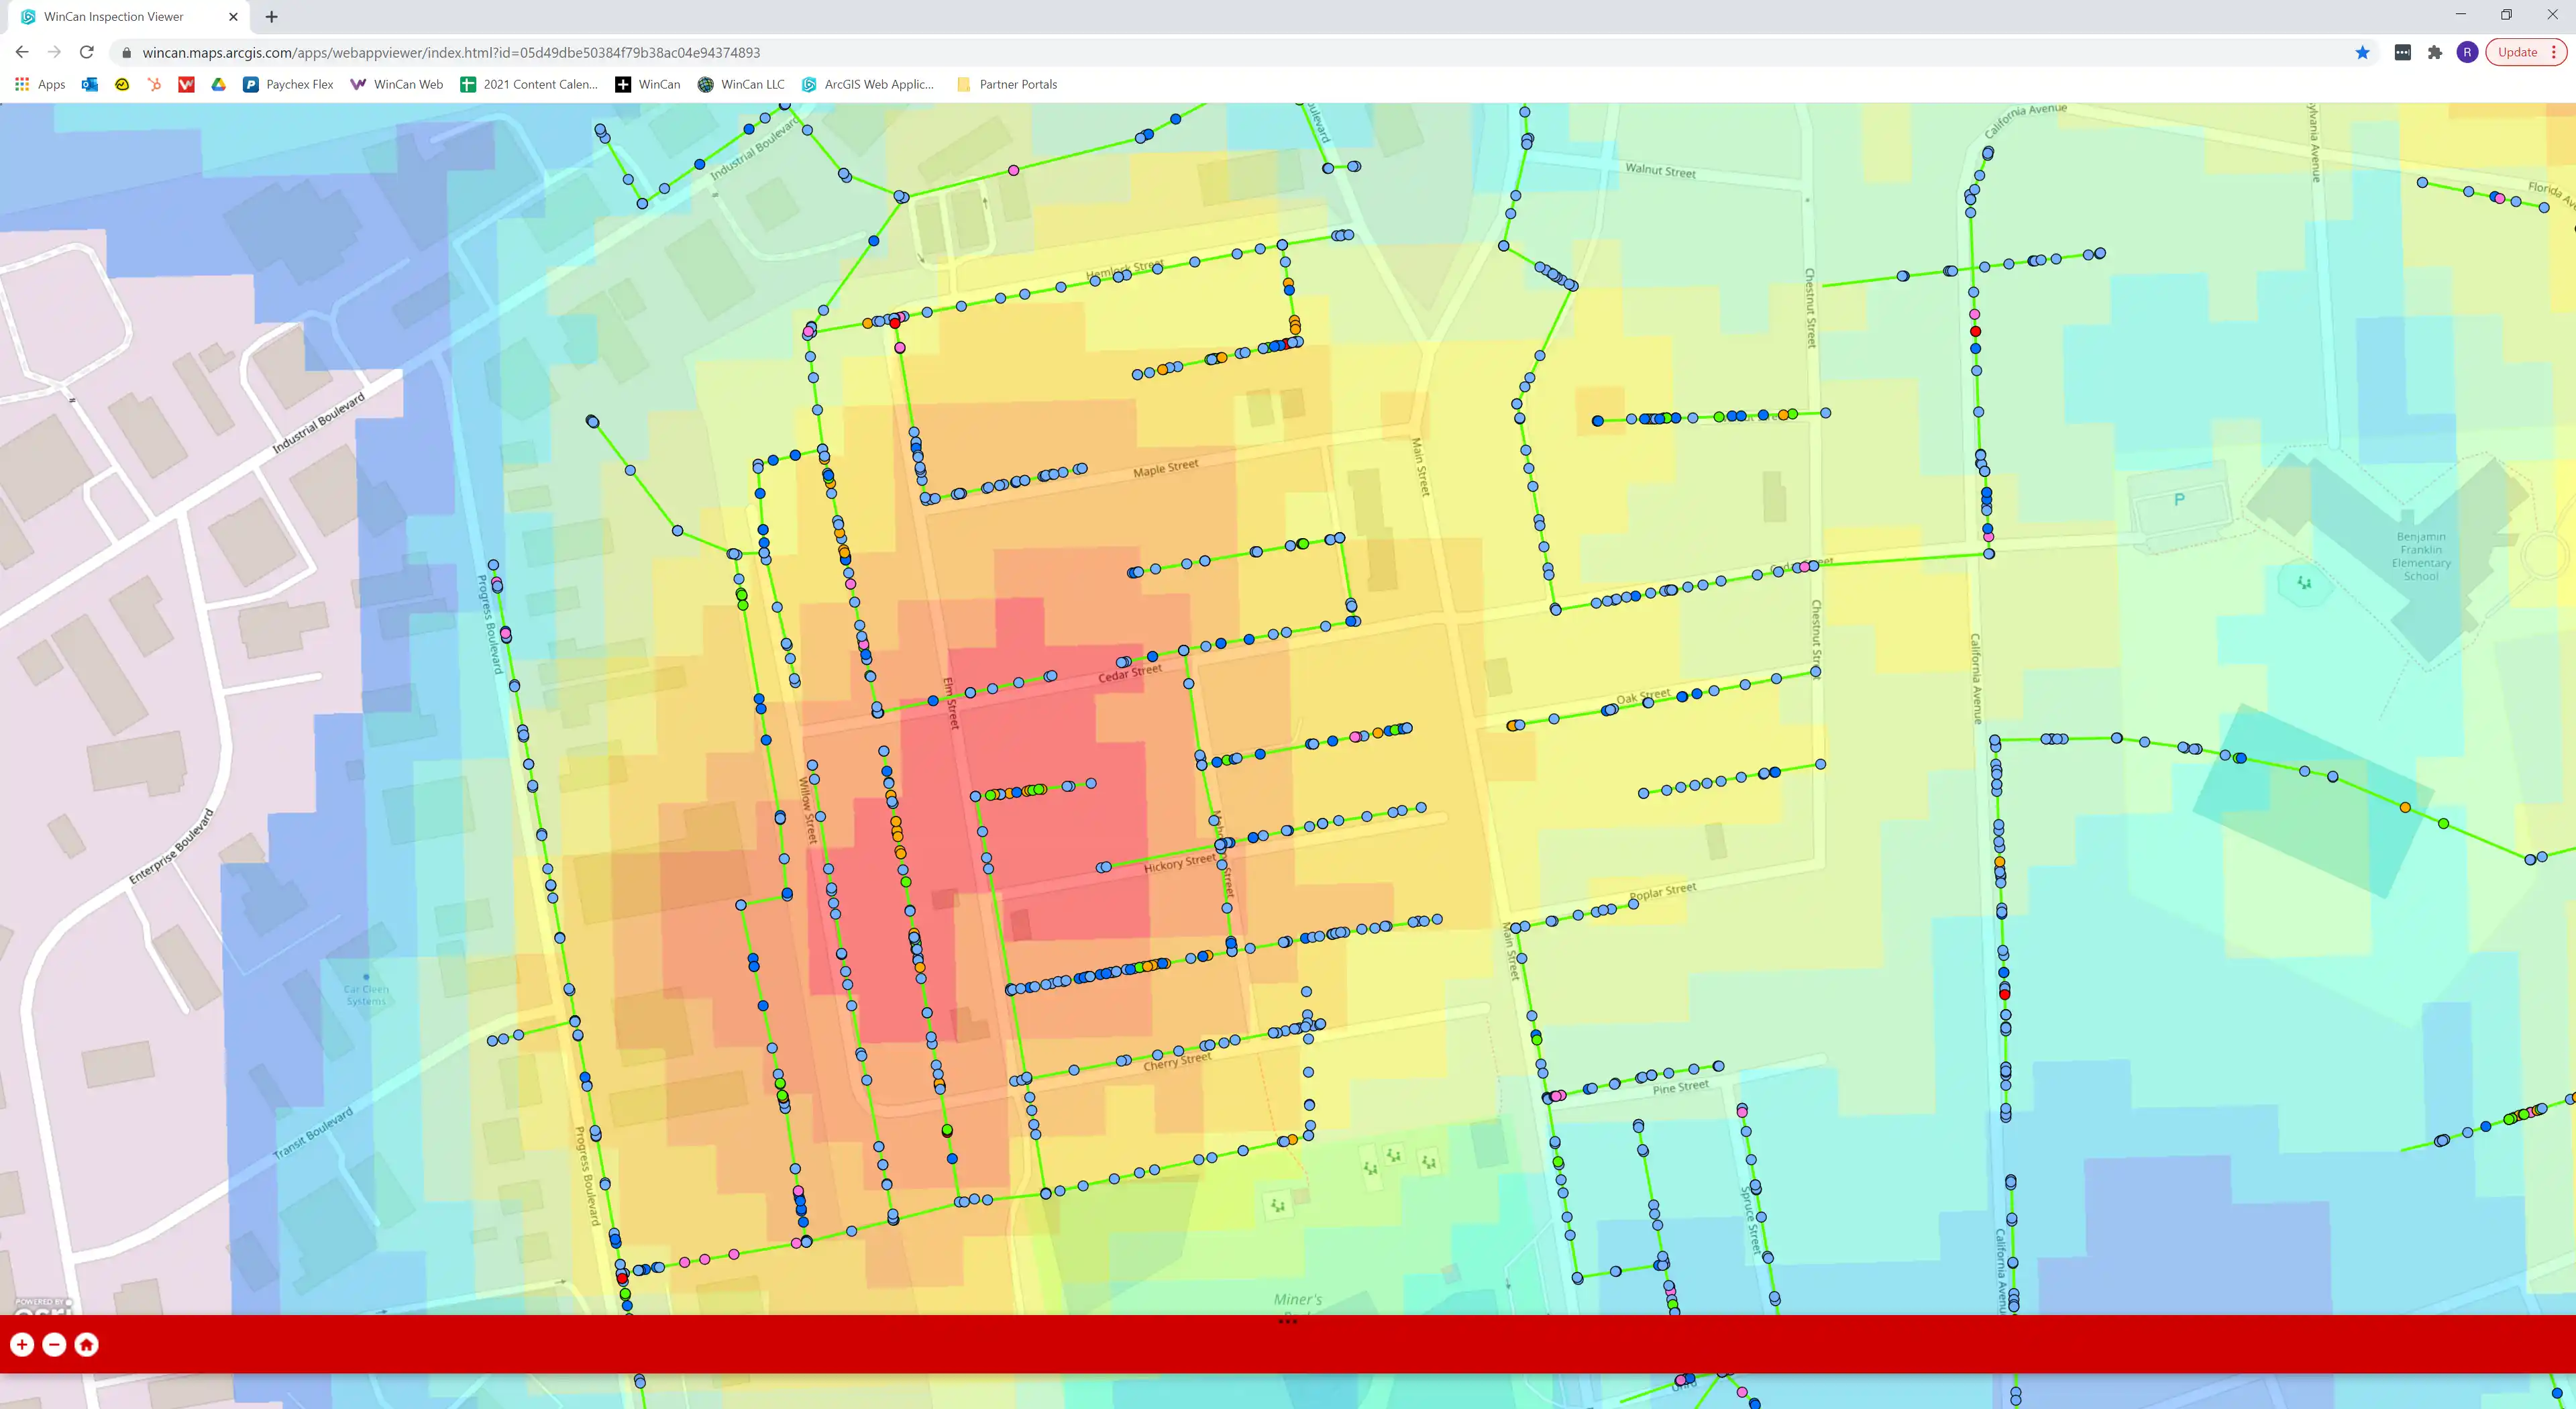
Data takes on new meaning when it’s laid out on a map. Heat maps, iconography and geographical features all help build a clearer picture. The human brain naturally processes images differently than it does letters and numbers, allowing us to gain a unique understanding of data sets and how they interact with each other. In the world of wastewater management, mapping data can make it easier to understand where a sewer system is located, as well as potential risks to the community and infrastructure.